MarketOwl

Driving investment intelligence through data science for portofolio managers, investment bankers and analysts.
The ambition behind this full-stack data science project using cutting edge RPA, NLP and Data Visualization is to help drive fast and efficient decision making for the analysts, investors and managers @ capstone sponsors DA Davidson. They manage a diverse portfolio with assets worth more than $600 million.

Problem
Tediously analysts and investment bankers regularly need to go through verbose 10-K and 10-Q filings and sit listen to the earnings calls for over 5000 companies!

Objective
The objective was to build a robust and scalable full-stack data science solution utilizing cutting-edge technologies like Ui Path, Snowflake, and NLP.

Benefits
Allows the end-user to quickly and efficiently take decisions based on the earnings call transcripts and 10-K, 10-Q fillings.
Solution Architecture
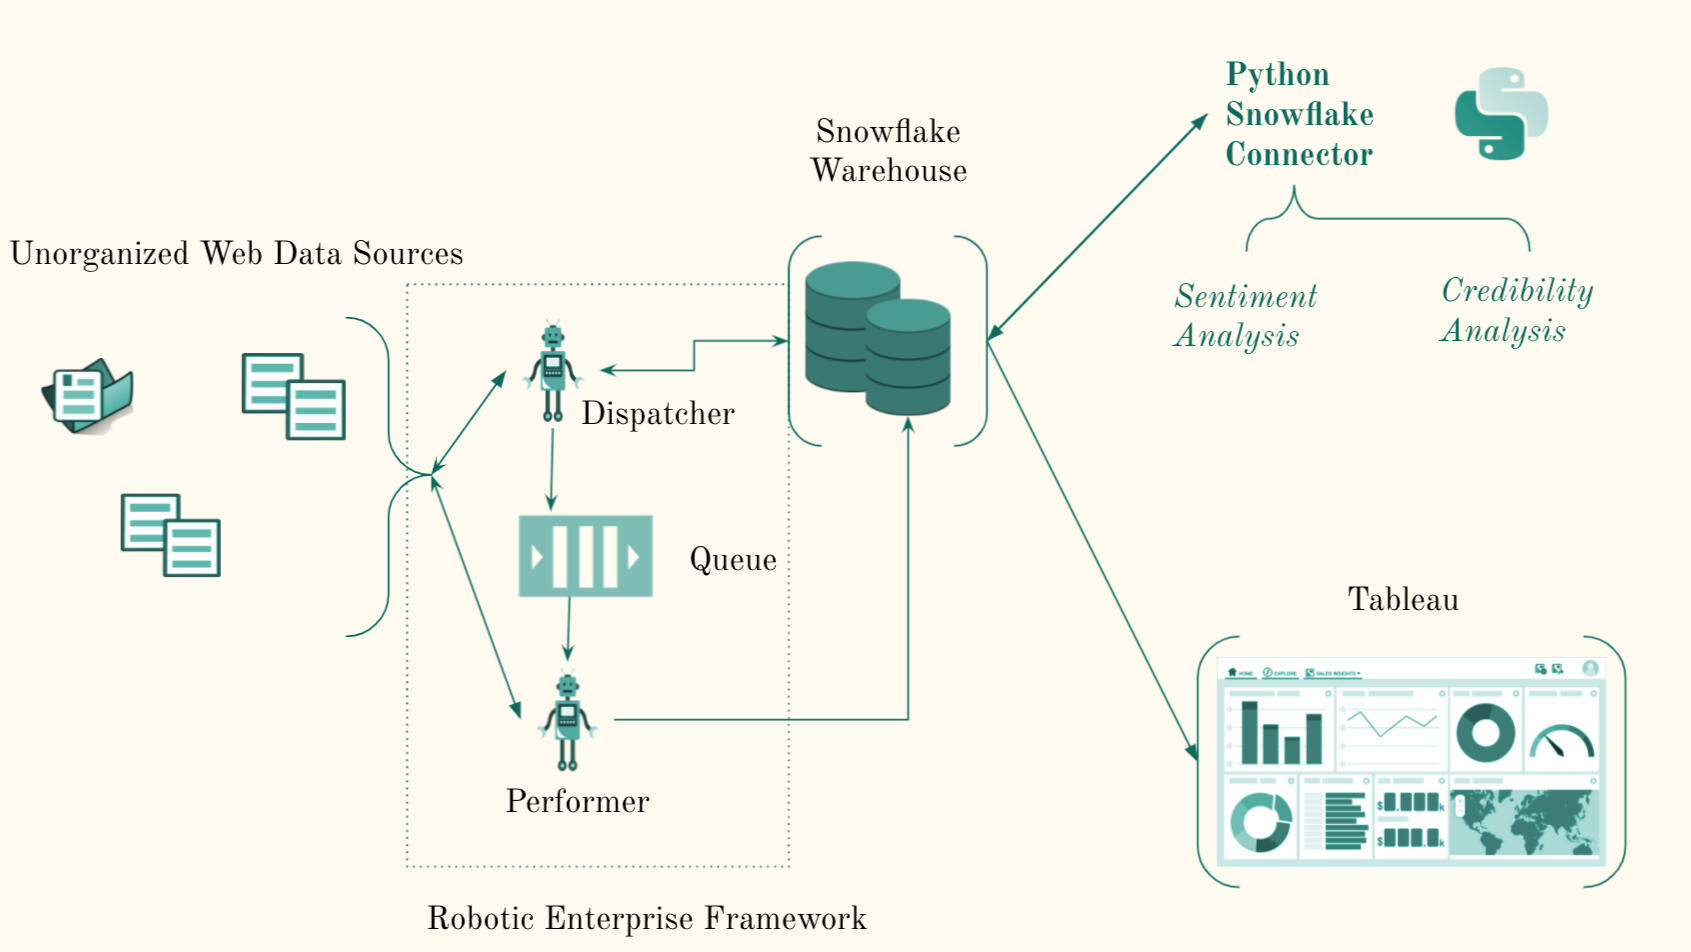
Data Pipeline
2 UiPath robots work in a robotic enterprise framework for optimization and continuous integration
The dispatcher robot explores the web and scrapes the new links to scrape and adds them to the queue
The performer robot then goes to the link and scrapes the unorganized fillings/transcripts in an organized manner and feeds into snowflake
An organized schema on snowflake allows stores data for querying


Data Anlaysis
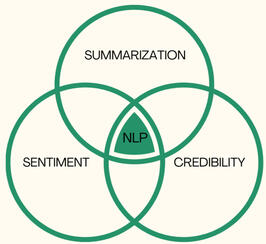
Using the python snowflake connector an automated data/NLP processing script creates the following metrics
Abstract summarization and topic modelings
Sentiment score and label for transcripts and fillings help to understand industry trends
These documents are intentionally complicated to hide information hence we calculate credibility score to measure the trustability of the document
Data Visualization
End-user can interact with a robust and flexible tableau workbook
The workbook can be connected directly to snowflake and automatically refreshed with new data
The visualizations allow the user to slice the data by Industry/Sector, look at trends over time, drill down to a single transcript and get quick summarizations

Results and Business Outcomes
Comprehensive Data Source

Integrated 20+ years of filings and transcripts of 500 companies (2 GB) in clean, normalized way for easy querying beyond the scope of this project.
Automated NLP Analysis

Automated NLP analysis using python to mine the documents and generate metrics.
Tableau Dashboard

Customer-oriented dashboards with robust filtering to help perform self-service comprehensive analysis and enable quick and efficient decision making.
Demos
1. Data Pipeline
2. Data Visualization
INFO WARRIORS